
I had a lot of fun and a hard time during this CTF, but the challenges are really awesome. I spent the whole time solving one challenge: Incident Response (Misc 1000). In my opinion, this challenge closely resembles a real-life scenario and I’m glad that I’ve learned a lot out of it. So here goes the write up for it!
Memory forensics - Identifying the malicious program
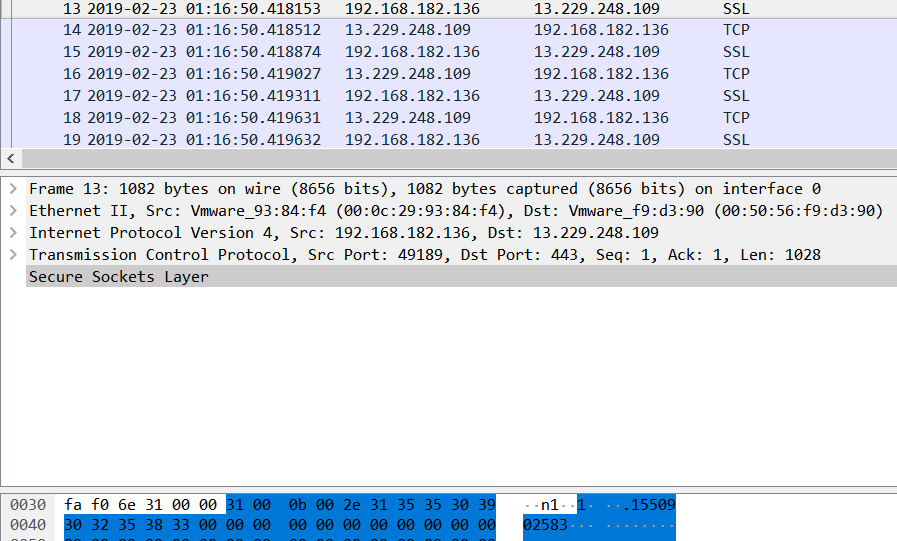
In this challenge, we’re given a network capture and a memory dump of a Windows machine. Opening up the network capture, we can see that the majority of it is network activity between 192.168.182.136 (a local IP address) and 13.229.248.109 on port 443. These activities are identified as SSL because it’s on port 443 but there are some data that doesn’t seem to be SSL/TLS, for example: ASCII data at the beginning of packet #13, and there are patterns in most of other packets. This made me think that it’s not really SSL/TLS traffic but custom encrypted data.
A useful tool for memory forensics is Volatility. Based on the information gathered from the pcap, we can think of looking at network connections in the dump to identify which process was making it.
1
2
3
$ vol.py -f WIN-2VTHJA77HMB-20190313-143547.raw --profile=Win7SP1x86 netscan
...
0x7f8a98d8         TCPv4    192.168.182.136:49158          13.229.248.109:443   ESTABLISHED      1964     explorer.exe
There goes the IP address of the C2 server, and it’s definitely strange that explorer.exe was making internet connections. This highly indicates that explorer.exe was injected with malicious code. We can dump the memory of explorer.exe to find the malicious code if it’s direct injection, or we can examine the DLLs loaded by explorer.exe if it’s DLL injection. Listing the DLLs, we can see a very suspicious one in an uncommon location
1
2
3
4
$ vol.py -f WIN-2VTHJA77HMB-20190313-143547.raw --profile=Win7SP1x86 dlllist -p 1964
...
0x6eb30000    0x25000        0x1 C:\Users\misc\AppData\Local\Temp\FileProcess.dll
...
We can then dump these DLLs using the following command:
1
$ vol.py -f WIN-2VTHJA77HMB-20190313-143547.raw --profile=Win7SP1x86 dlldump -p 1964 -D explorer_dll/
Now it’s time for some reverse engineering :)
Reverse engineering the DLL
This is probably the hardest part. Now that we’ve identified the malicious code, we need to figure out how it encrypts the data, and the flag is probably in the decrypted data. From the network capture, we can see that traffic mostly comes from the client so there is exfiltration going on. These are good hints to identify possible API imports in the DLL:
CryptDecrypt,CryptEncryptand other crypto APIssocket,connect,sendto communicate over the network
2.1. First glance - static analysis
Opening the binary in IDA, we can already see some of these imports. We arrive at the DllMain function and there’s the call to loc_6EB32960. However, this is not a function and IDA failed to identify this as a function. This is the first time that I’ve ever dealt with anti-disassembly and it’s quite interesting to know how this works. If you go to the code being called above and keep going down a little bit, you’ll see an instruction highlighted in red at 6EB32A25. The strange thing is right before that, there a jump to 6EB32A25 + 1, so this can’t be the correct disassembly.
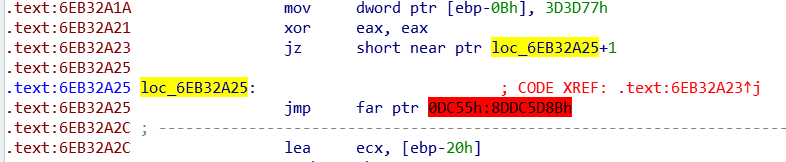
Hitting P to create a function at 6EB32960 failed, so to fix this, I undefined the instruction highlighted in red, click on 6EB32A26 (6EB32A25 + 1), pressed C to define this as code and patched the only byte left as nop. Now we can go back to the function prologue and hit P again to define a function. Worked like a charm! At that point, I still wasn’t sure if this would impact the code being run, but it’s nice to be able to see the code in graph mode, so I went on and fix all the remaining failed disassembly using this method. There are a few places with random bytes (indicated by the db instruction) that you can also nop out to fix the disassembly.
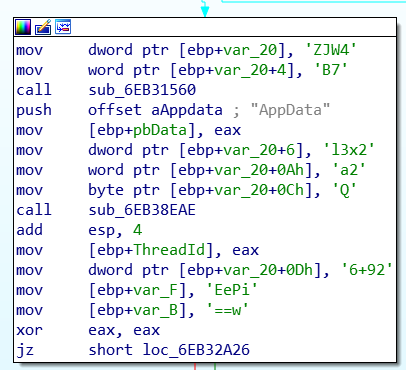
There’s a few things worth noting in this start function:
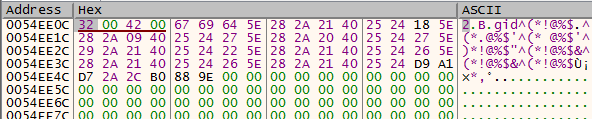
- There are stack strings which looks like base64, but decrypting it yields no readable ascii.
![base64]()
- It gathers some system information and writing it to
sysinfo. - It creates 3 threads of functions at the following locations:
6EB31AE0(Thread1),6EB31D70(Thread2) and6EB32230(Thread3)Thread1contains more stack strings and call APIs such asGetDC,GetCompatibleBitmap,BitBlt, which indicates that it may be taking screenshots.Thread2makes networking APIs call such ashtons,socket,connect,send.Thread3also makes networking APIs call includinginet_addr. This can be where the C2 IP address is saved.
Diving more into these functions, I figured out more important functions:
sub_6EB31050: basically sprintfsub_6EB31090: Write a screenshot to a file.sub_6EB31360: A base64 encode/decode function.sub_6EB31560: Get the current process namesub_6EB31620: A decryption functionsub_6EB31820: Send file over the networksub_6EB32180: Run a reverse shellsub_6EB32360: The action is taken based on global boolean variables.- Get the IP address of the C2 server and save it into a global variable at
6EB518A0. Get the screen sizes and also store it in global variables. - Open directories containing “AppData” in the path.
- Perform some cryptographic operations.
- Get the IP address of the C2 server and save it into a global variable at
How did I discover those functions? I basically looking at return values from API calls that are stored in global variables and how those global variables are used. For example:
Thread3opens a socket and saves it to a global variable at6EB50948. Right after that, a function is called and it uses this socket along with theOpenProcessAAPI with the parameter toC:\Windows\System32\cmd.exe(as a stack string).- Global boolean variables are used in if statements to make decisions about the actions being performed. Also notes to increment of some variables because they are used as counters across the threads to also make decisions about actions.
The descriptions provided above are really superficial because I also made guesses, but they captures the basic actions being performed.
Now let’s put together the pieces.
2.2. Putting them all together - Dynamic Analysis
The tools that I used for dynamic analysis include Procmon, Process Explorer and x64dbg. Debugging the DLLs can be a little bit difficult because it only runs inside explorer.exe. After trying several ways to inject the DLL into explorer.exe without any luck, I ended up using the AppInit_DLLs registry key to load it when explorer.exe is run.
2.2.1. File system activities
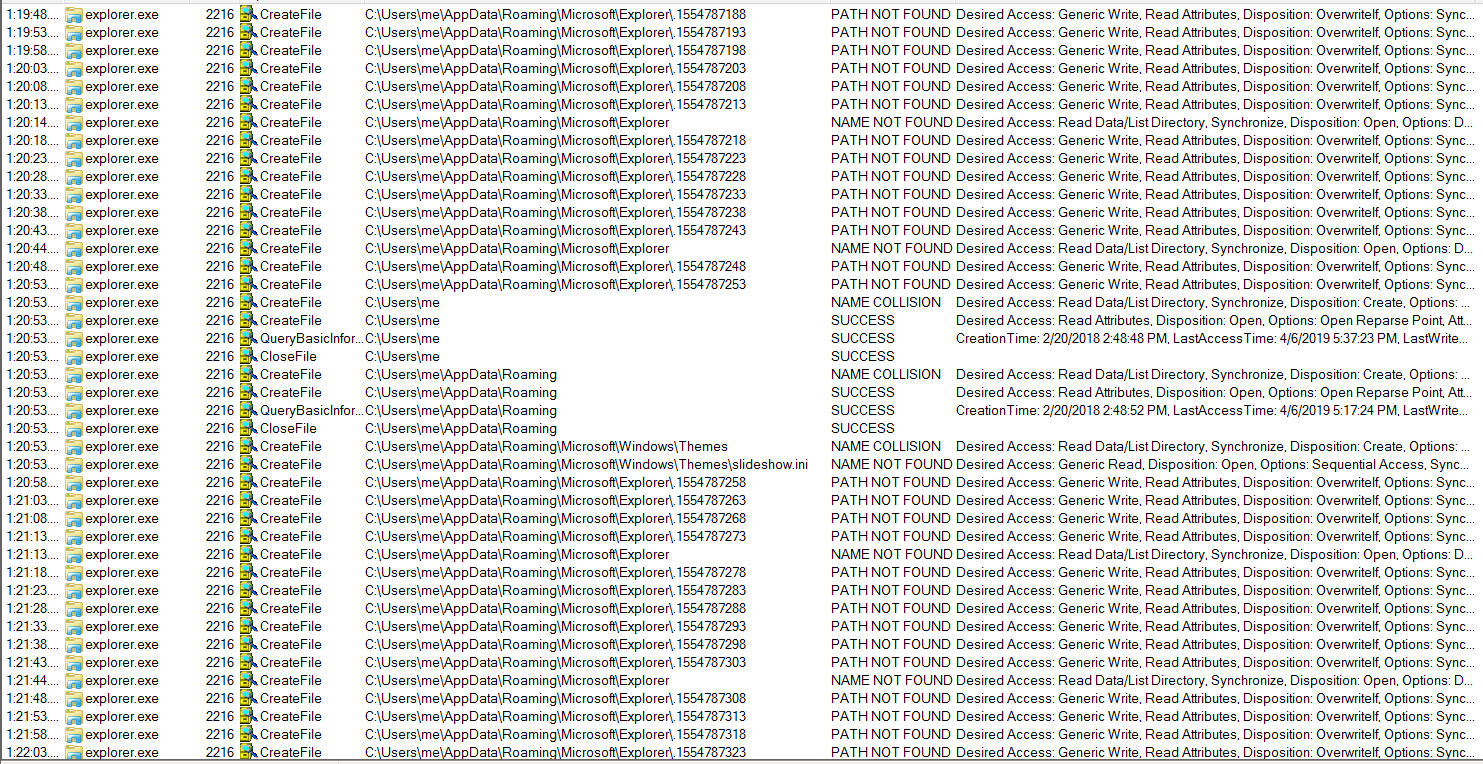
Monitoring file system activities, we can see the folders and files that it’s trying to access. There’s a noticeable amount of activities in C:\Users\<username>\AppData\Roaming\Microsoft\Explorer\ and it’s because it couldn’t find the path. The Explorer folder wasn’t there! This is related to the function all at the very beginning of the DLL. sub_6EB32360 is called to initialized data such as IP addresses and directory to write data to. For some reasons, the function failed to initialized the data as intended because all the boolean variables that I’ve mentioned previously couldn’t be set. Setting breakpoints at CreateFile and WriteFile can reveal the same information in the debugger (which is the actual way that I figured this out.) So I just created the folder myself. If the initialization were successful, a file named sysinfo would have been in the folder, but it was never in there.
After that, it runs that initialization function again and finally creates 3 threads with the 3 functions that we’ve found in static analysis. As mentioned before, Thread1 is responsible for taking screenshots and saving them to files. The filenames are unix timestamps, which can also be observed in the pcap. More details are in the next section.
Note: If you encounter the same issue, you will need to create the folder manually. Otherwise, you won’t be able to observe the network traffic because there is no data to be sent.
2.2.2. Networking activities
Observing more closely, around the call to send in Thread2, we can see the string “1” being copied and a function call to sub_6EB31820. Inside sub_6EB31820, we can also see API calls to send and the string “2”. Going back to the pcap, we can see packets starting with “1” and “2”, so these indicate the data type being sent.
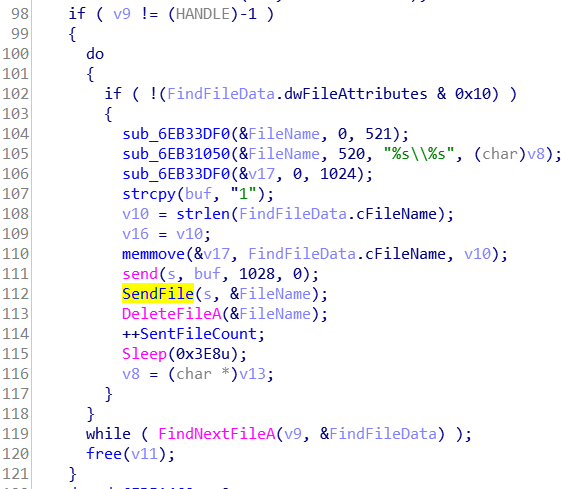
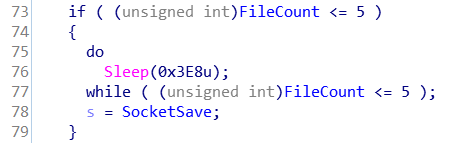
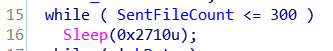
There are 2 significant counters that are used: A SentFileCounter at 6EB51458 and a CurrentFileCounter at 6EB51460. CurrentFileCounter is incremented in Thread1 every time a screenshot is taken, and SentFileCounter is incremented whenever a file is sent in Thread2. When does the data get sent? The data only get sent when the CurrentFileCounter is at least 5. If the SentFileCounter reaches 0x12C, a reverse shell is spawned by Thread3.
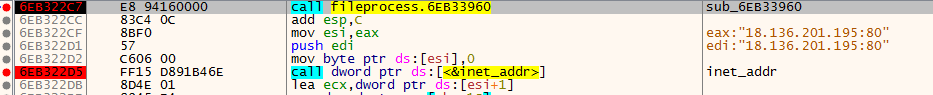
It is worth noting that there are 2 separated sockets being used: 1 is for the reverse shell in Thread3 and 1 is for sending the screenshots. Setting breakpoints on htons, inet_addr, socket, connect and send will reveal the information being sent over the network. Following are the 2 types of packets being sent that we’ve observed before: one starts with “1” and one starts with “2”.
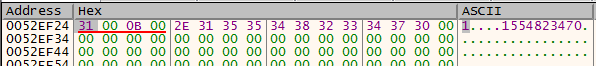
The first packet is the unencrypted filename that we can tell from procmon in the previous section. We still have no idea what the second packet is, but the first few bytes are similar to many of those in the pcap, so this highly indicates that the same encryption key is used.
2.2.3. Cryptographic functions
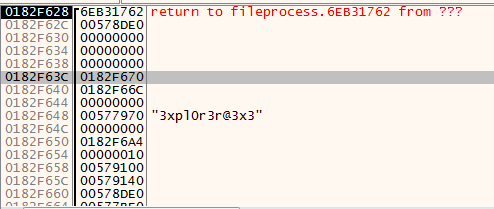
The decryption function is called a lot of times across the program. Setting breakpoints at CryptDecrypt will just reveal the decrypted data. While debugging, I did notice special strings being passed around.


2.2.4. Adding everything up
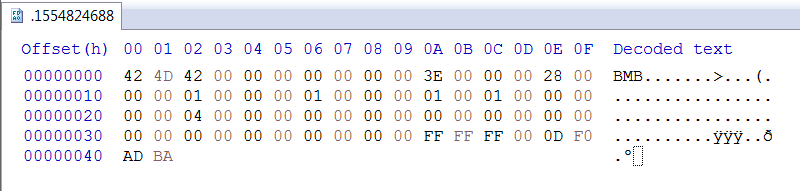
Now that we know the second type of packet is encrypted, we also have the data that the program generated. Opening up the files in a hex editor, we can see that it’s an unencrypted bitmap image.
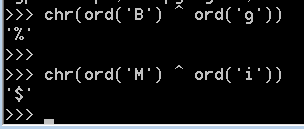
It turns out that the program uses XOR encryption to encrypt the data. The encryption can be observed inside sub_6EB31820 and also by XOR-ing the first few bytes of the encrypted and unencrypted data. The key is stored in a global variable at 6EB51920.
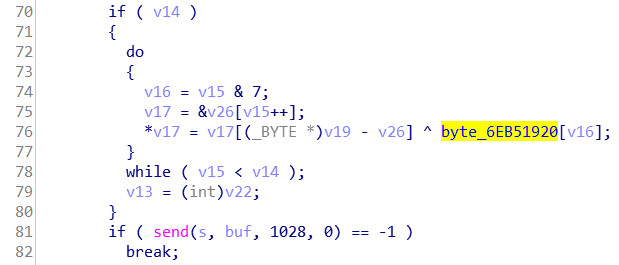
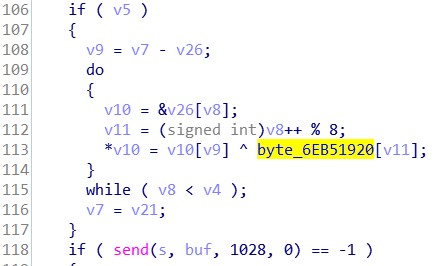
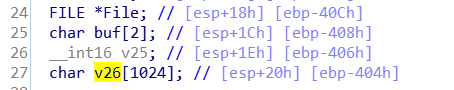
Also notice that there is a huge buffer in this function, which is used to store the data being sent over the network.
Now we just need to observe the memory that stores the key and we are able to get it.

Notice that the length of sent data is 1028 but the buffer is only 1024, so there is a 4-byte header before the actual data starts. In addition, only the first 8 bytes of the key is used. The job now is to parse all the packets sent to the server from the pcap, identifying the packets of type 2 that we need to decrypt and concat them together and XOR-decrypt them.
My solution was not able to properly decrypt the packets, but the images still showed up and it was sufficient to see the flag. The images were staggered so I made another script to (somewhat) fix the images. They are still really bad but I was lucky enough to see that flag :D
Here is the image before fixing:
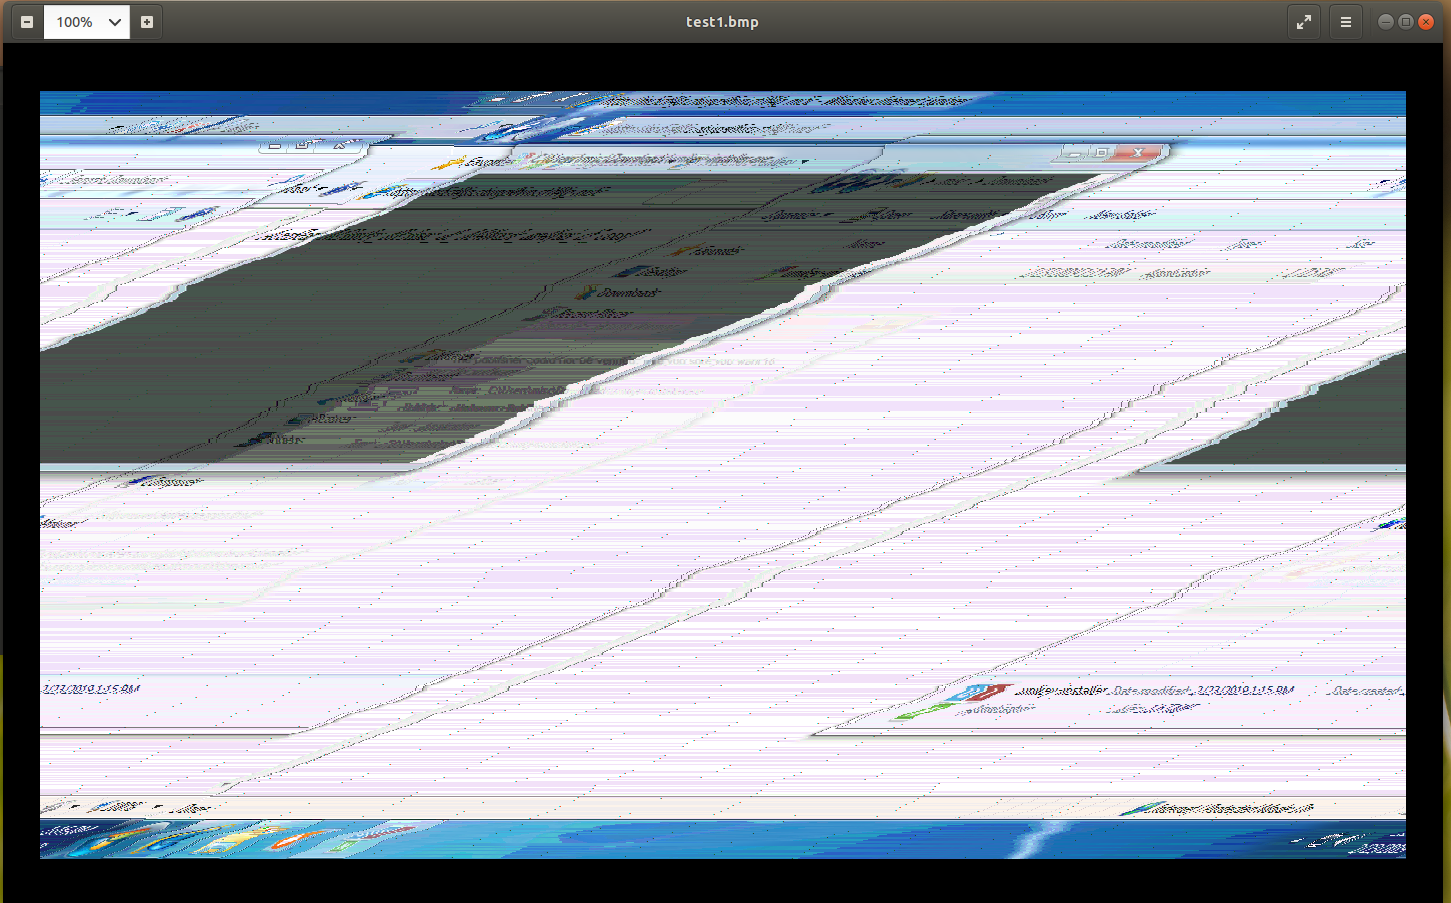
And here’s the image after fixing:
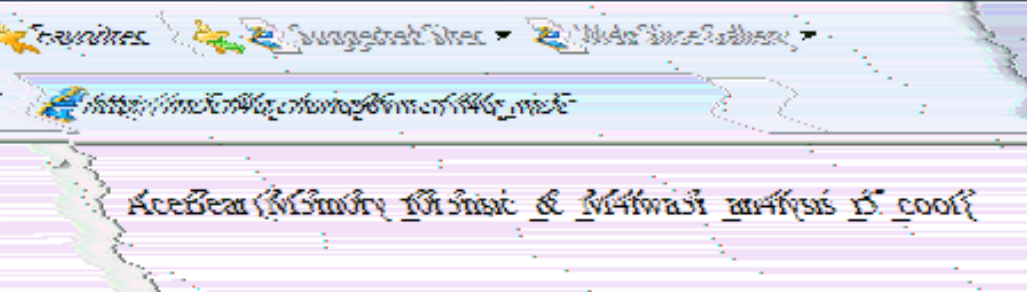
There’s the flag: AceBear{M3m0ry_f0r3nsic_&_M4lwa3r_an4lysis_i5_cool}
Also if you look carefully, there’s an URL in the picture in Internet Explorer. I tried going to the URL but it was already down at that point: http://mi5cfl4g.chung96vn.cf/fl4g_mi5c
Full solution can be found here: https://github.com/ducphanduyagentp/ourCTFs/tree/master/2019/acebear-ctf-19/misc/incident-response
Future improvements
There are several things that I can improve in the future and would have saved me a lot of time looking at this challenge:
- A quick way to inject the DLL into the process. I spent many hours debugging
explorer.exeinside x64dbg and just manually loaded the DLL every time, which was really time-consuming. - A quick way to patch the bytes used for anti-RE. I should probably learn idapython :)
If you have any questions, please feel free to leave a comment below or reach out to me on Twitter. Thanks for reading!